Statistics Estonia
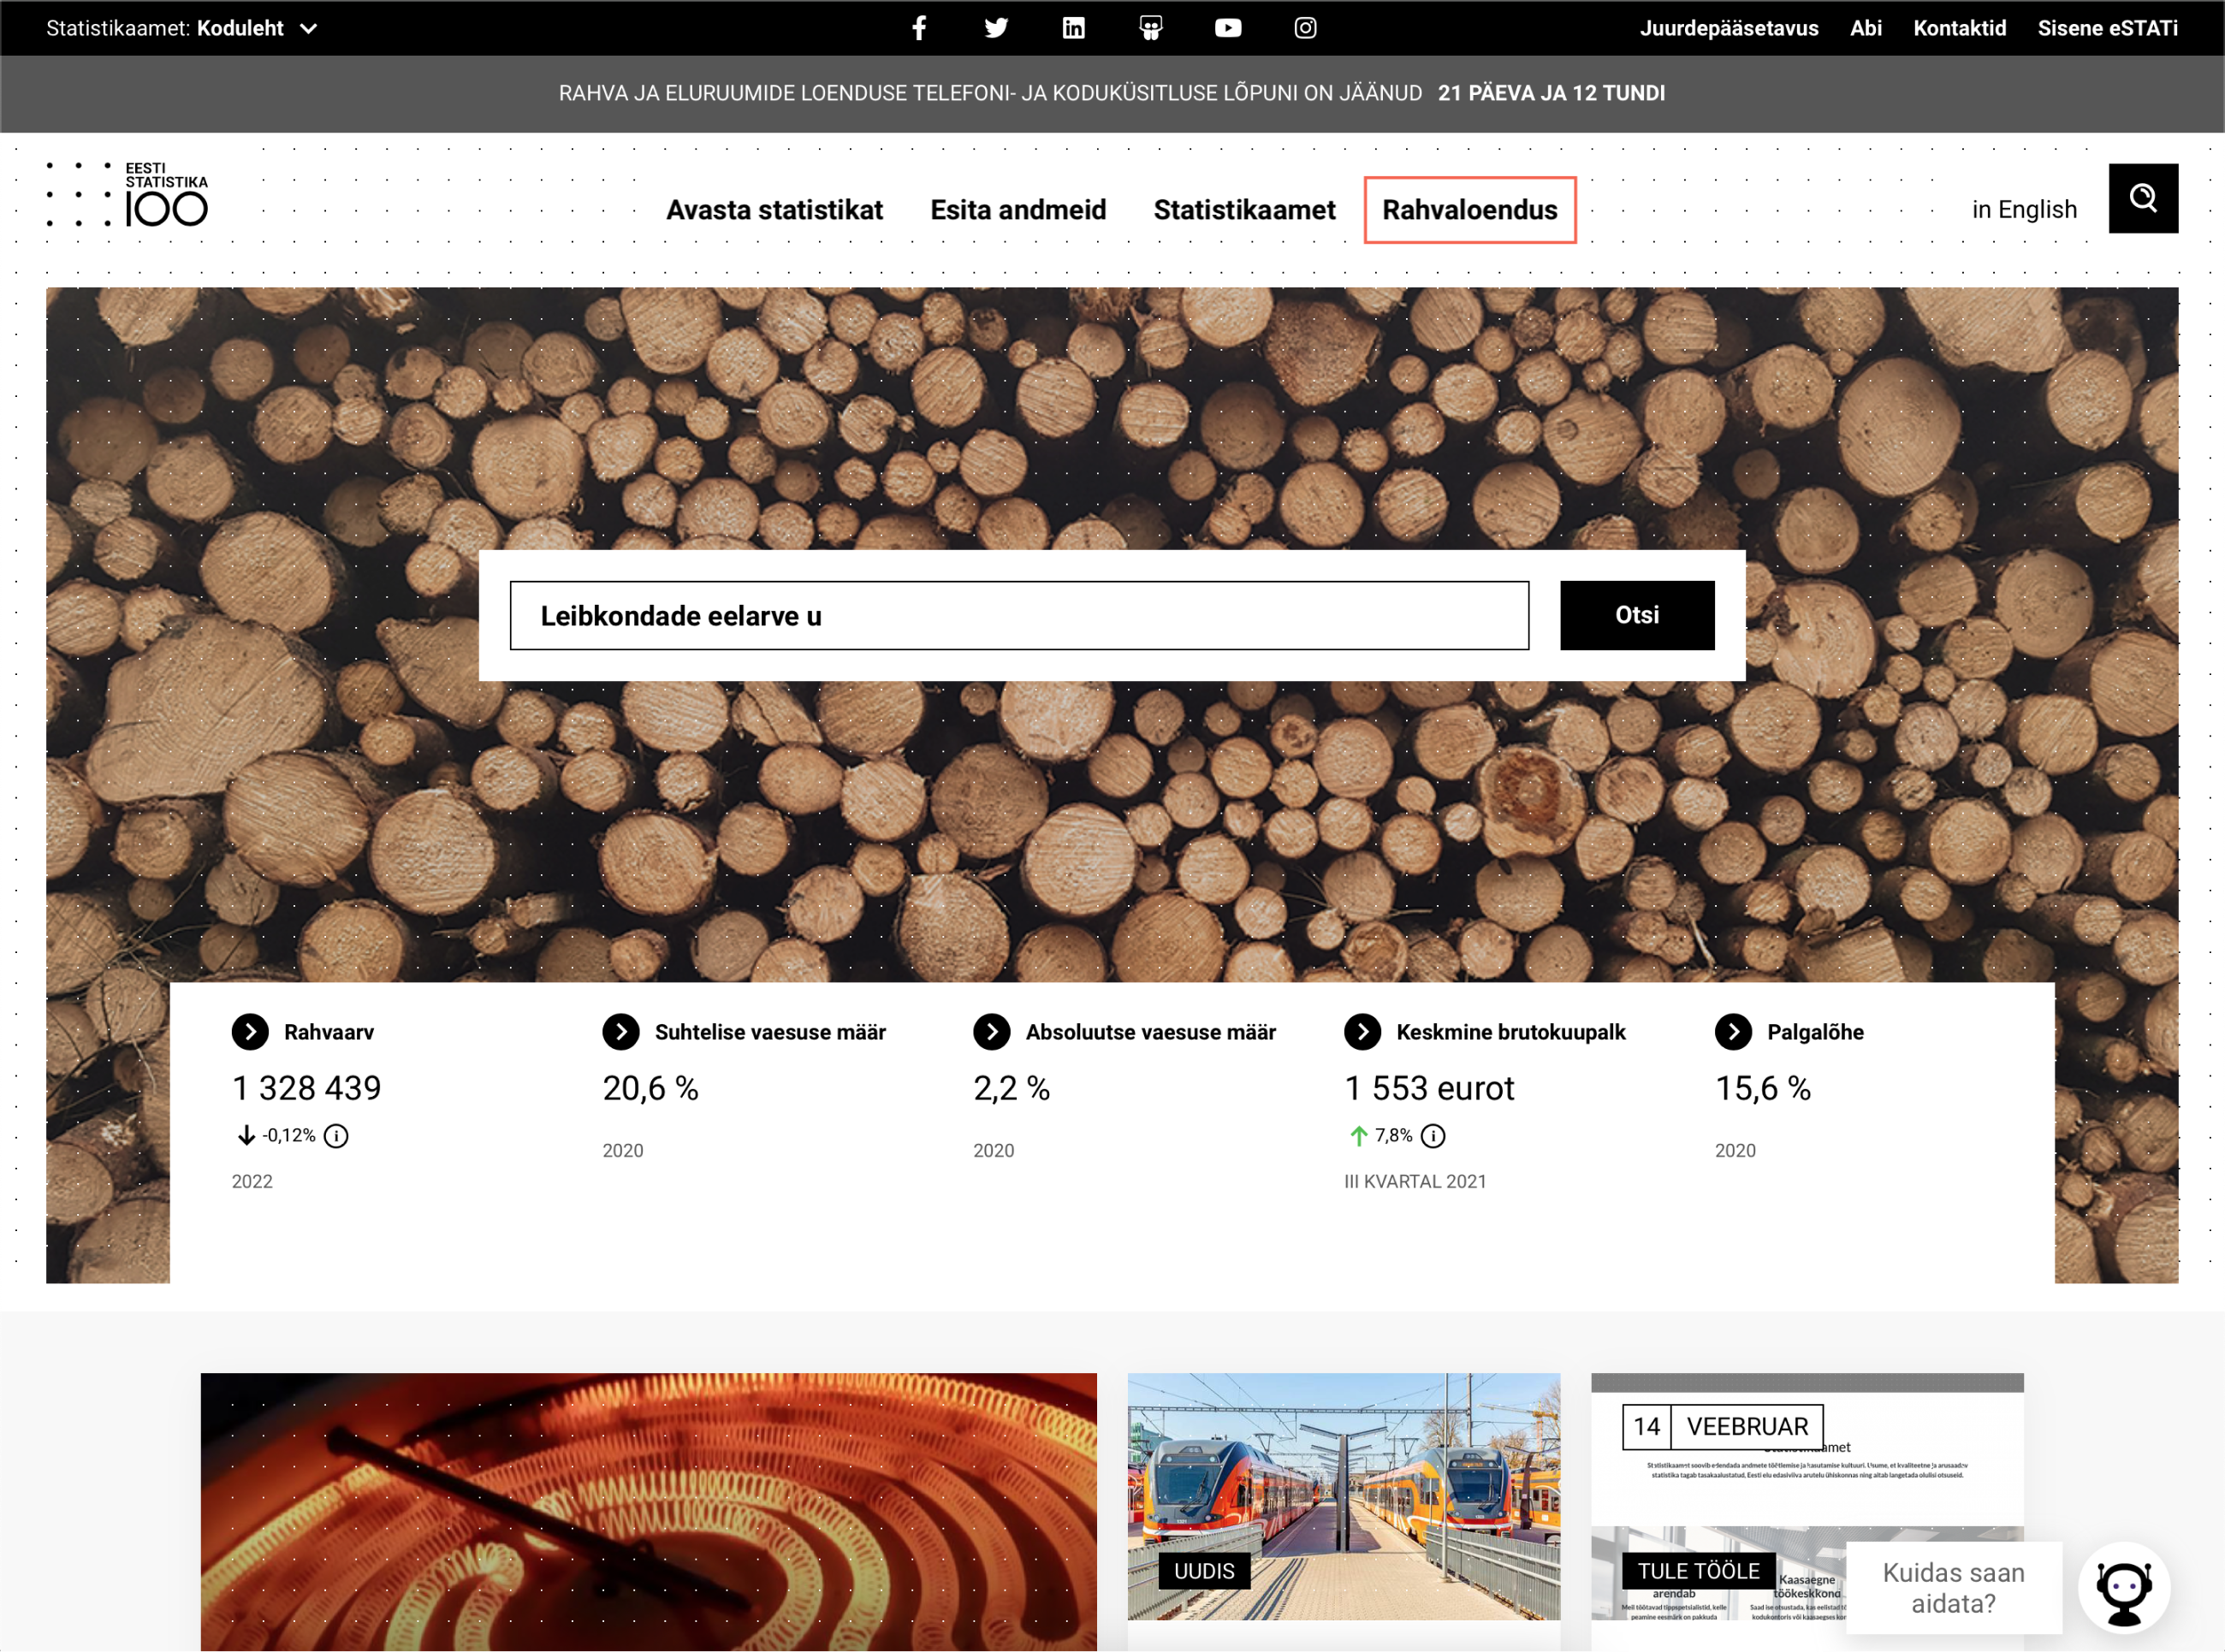
The aim of Statistics Estonia's new website is to ensure more efficient dissemination of reliable data and to offer a more user-friendly experience to various stakeholders.
SUMMARY
In order for those interested in statistics to find the necessary information faster and more conveniently, the search system of the new website has an automatic suggestion function and new and practically structured topic pages created by fields.
The new website brings statistics closer to people than the database, and the most important indicators can now be clearly found in the form of information cards and visual graphs.
It was a long-term project, where in addition to technically extensive development work, Web Design also carried out service design and business and system analysis.
The 14-month project was completed in cooperation with Helmes and the new visual identity of Statistics Estonia was created by Velvet.
SERVICE DESIGN AND ANALYSIS
During the stage, we conducted focus group interviews, mapped the personalities of different user groups and their itineraries. Based on this, we created the design designs of the original web and tested the constantly evolving prototype among the representatives of the target groups using eye tracking technology.
The end result is an advanced prototype for user-friendliness and easy access to data.
BUSINESS AND SYSTEMS ANALYSIS
With the input of the end user as the most important consumer, we moved on to the stage of technical analysis in order to use the obtained information also in the web architecture and in structuring the logical findability of the data.
The focus was on meeting the service requirements of Statistics Estonia, unifying and interfacing the various applications of the external web (for example, Tõetamm, map applications, etc.) as well as approving the final design.
WEB DESIGN (UI)
The design is based on three aspects - content, clarity and discoverability. As the new user groups of Statistics Estonia include schoolchildren, pensioners, entrepreneurs, journalists, researchers, etc., this is an important source of information for many consumers with different user behavior.
The emphasis is on data, graphs and statistics cards so that the content is easy to see and well structured to the eye.
DEVELOPMENT
The new website has been developed for the Drupal 8 content management platform. Among the back-end development work, large-scale content migration was also performed and various interfaces were integrated with, among other things, the database of Statistics Estonia, which constantly updates data maps, graphs and also the automatic search system in real time.
TESTING AND QUALITY CONTROL
Quality is paramount for such large and large-scale developments.
In order for everything to be functional at the end of the development stages and for the work not to fall behind later, we performed functional and non-functional testing as a continuous process.
CONTENT CREATION AND MANAGEMENT
A new content concept was created for the website together with the Web Expert copywriter, and in the future the Drupal platform will allow Statistics Estonia's own content managers to conveniently change the information and elements of the website.
If necessary, you can create general and industry-specific topic pages with special solutions, change the design of the news portal on the home page and reschedule news, add topic maps, graphs, tables, alerts, calculators, surveys, web forms, etc.
There is a lot of data and the most important thing is to process and present it as an understandable set of information to ensure a positive user experience for everyone interested.

